|
Custom Reporting Home Microsoft Excel Microsoft Access SQL Server Visual Basic |
Most any company larger than a "mom and pop" operation is likely to have one or more
enterprise systems. Typical enterprise
systems are customer relationship management (CRM), enterprise resource planning (ERP), human resource information
systems (HRIS), records management systems (RMS), accounting systems, and document imaging systems. With the
possible exception of accounting systems, these systems seldom have reports that deliver actionable
information to managers, the key tool for developing good, actionable management information. Unfortunately, companies who don't have large IT departments tend to not have the ability to harness data from these systems. They come with "canned" reports, and perhaps a report builder, but it takes a skilled database analyst to be able to extract data that is actionable to a business. Even companies with large IT departments tend to have a gap between the SQL Server expertise in the IT department and actionable data in the hands of managers. This is where we can help. We have a wide range of experience, from helping fire departments and public schools extract data from enterprise systems to mid-sized companies working with payroll systems, HRIS, and training tracker systems, to large multi-nationals working with ERP, quality assurance, and fault tracking systems. In each case, while the SQL Server expertise existed in these organizations, no one at the operational level even knew how to ask for what would help them develop the key indicators that they needed. What tools do we use? Frequently, companies ask for Crystal Reports expertise. While Crystal Reports certainly is a powerful tool, we find two problems with Crystal: (1) It is not very easy for end users to use, and (2) it requires licensing for each user (we might add a third concern, that formatting is not as attractive as we'd like, but we're kind of nerdy like that). While we'll develop reports using any tool our customers desire, we prefer to use Visual Basic where a report is used frequently, or teaching users how to extract data from a database using Microsoft Excel or Microsoft Access. An example of our work using Visual Basic comes to mind. A report was needed from ASI Datamite for both the data entry into the system by production workers, and first pass yeild, or the number of times the product passed all requirements from a given operation. These reports would be run on a periodic basis, but would always collect the same kind of operational statistics, and present tools to check on the quality of production and the compliance with data entry requirements. This is a perfect application for Visual Basic, since the report can be placed on a network share and accessed at will. The system is incredibly easy to use. It presents one button for operation: 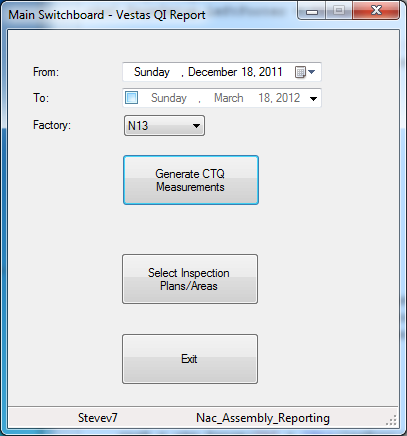 In this case, a chart was desired of four "critical to quality" measurements over the past three months. Rather than users being required to choose through a series of options, we set up this system one time to select the various items needed. Upon launching, the system sets the date range to the last three months. Clicking on the "Generate CTQ Measurements" button, after a few moments, opens up an Excel workbook with the raw data and summary charts: 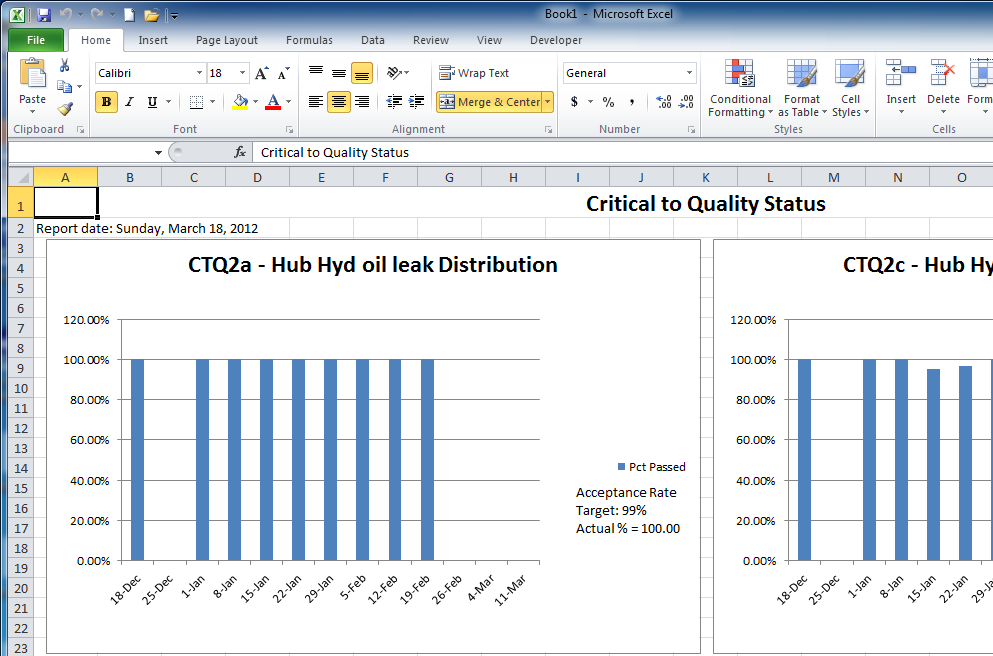 We have built numerous reporting systems, exporting to Excel when further processing is needed, or for screen viewing or printer output, from all sorts of enterprise systems. These kind of solutions range from 5-10 billable hours if you have the data catalog for the database (reverse engineering the database, depending on the complexity of the system, can add 5-20 hours to the task). Call (303) 403-0386 or e-mail to discuss custom reporting from your data store. |
Copyright 2012 Front Range Data Management Services